A New Way of Looking at Nitrogen Pollution
Extension educators from the Center for Land Use Education and Research (CLEAR) and their partners have developed an online tool that helps land owners and land use decision makers better understand the direct connection between their land and nitrogen (N) pollution in coastal waters.
The tool, called “N-Sink,” is the result of a multi-year collaboration of CLEAR with the University of Rhode Island Coastal Institute and the EPA Atlantic Coastal Environmental Sciences Division Laboratory in Narragansett, Rhode Island.
Nitrogen (N) pollution is a big threat to water quality, especially in coastal areas like Long Island Sound. Excess nutrients like N can fuel algal blooms that rob the waters of oxygen, directly harm marine life, and damage habitat. As a result, much attention has been paid to N pollution by the scientific community, including the development of many models designed to explore the transport and fate of N in our coastal watersheds. Most of these models focus on N “loadings,” i.e., estimating the amount of N being put into the system from sources like agricultural and lawn practices, septic systems, and atmospheric deposition from acid rain. Thus the focus is on what the total load of N is to the receiving water body, and what the impacts to that water body might be.
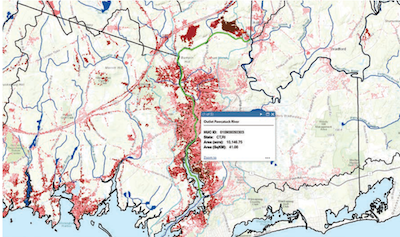
N-Sink uses a different approach that shifts the focus to the land within the watershed, rather than the receiving waters. The end result is a series of maps that help to provide specific geographic focus on which areas in the watershed are at the most risk for sending N to the coast (see maps, right). To do this, N-Sink uses particle tracking technology in concert with stream network data that includes information on nitrogen “sinks”—areas in the landscape that help to remove N from the system, like wetlands, riparian areas, lakes, and ponds. Depending on the sinks that it encounters along its journey to the coast, a unit of N could have very different fates, and thus very different impacts on water quality. For instance, a pound of N in one area of the watershed could be transported almost entirely to the coast, while another pound of N, applied just a short distance away, could take a different pathway through the stream network that results in the removal of a significant amount of N via sinks.
“One contribution of N-Sink is that it focuses on critical sink areas like wetlands and riparian corridors, which will hopefully lead to intensified efforts to protect or even restore these areas,”
says Extension Educator Chet Arnold. “Also, since the geographic specificity of N-Sink ties any location in the watershed to its likelihood of contributing N pollution, we think it can be useful both for land use planners when determining future uses, and land owners when discussing management practices on land already in use.”
The CLEAR team has created a state-of-the-art interactive N-Sink application where you can explore the maps for the entire Long Island Sound coast of Connecticut.
Article by Chet Arnold